Hi there 👋. To get started, navigate to the analytics page of your story by clicking the analytics icon in the menu: ![]() .
.
The anatomy of the analytics dashboard
The dashboard consists of the following sections:
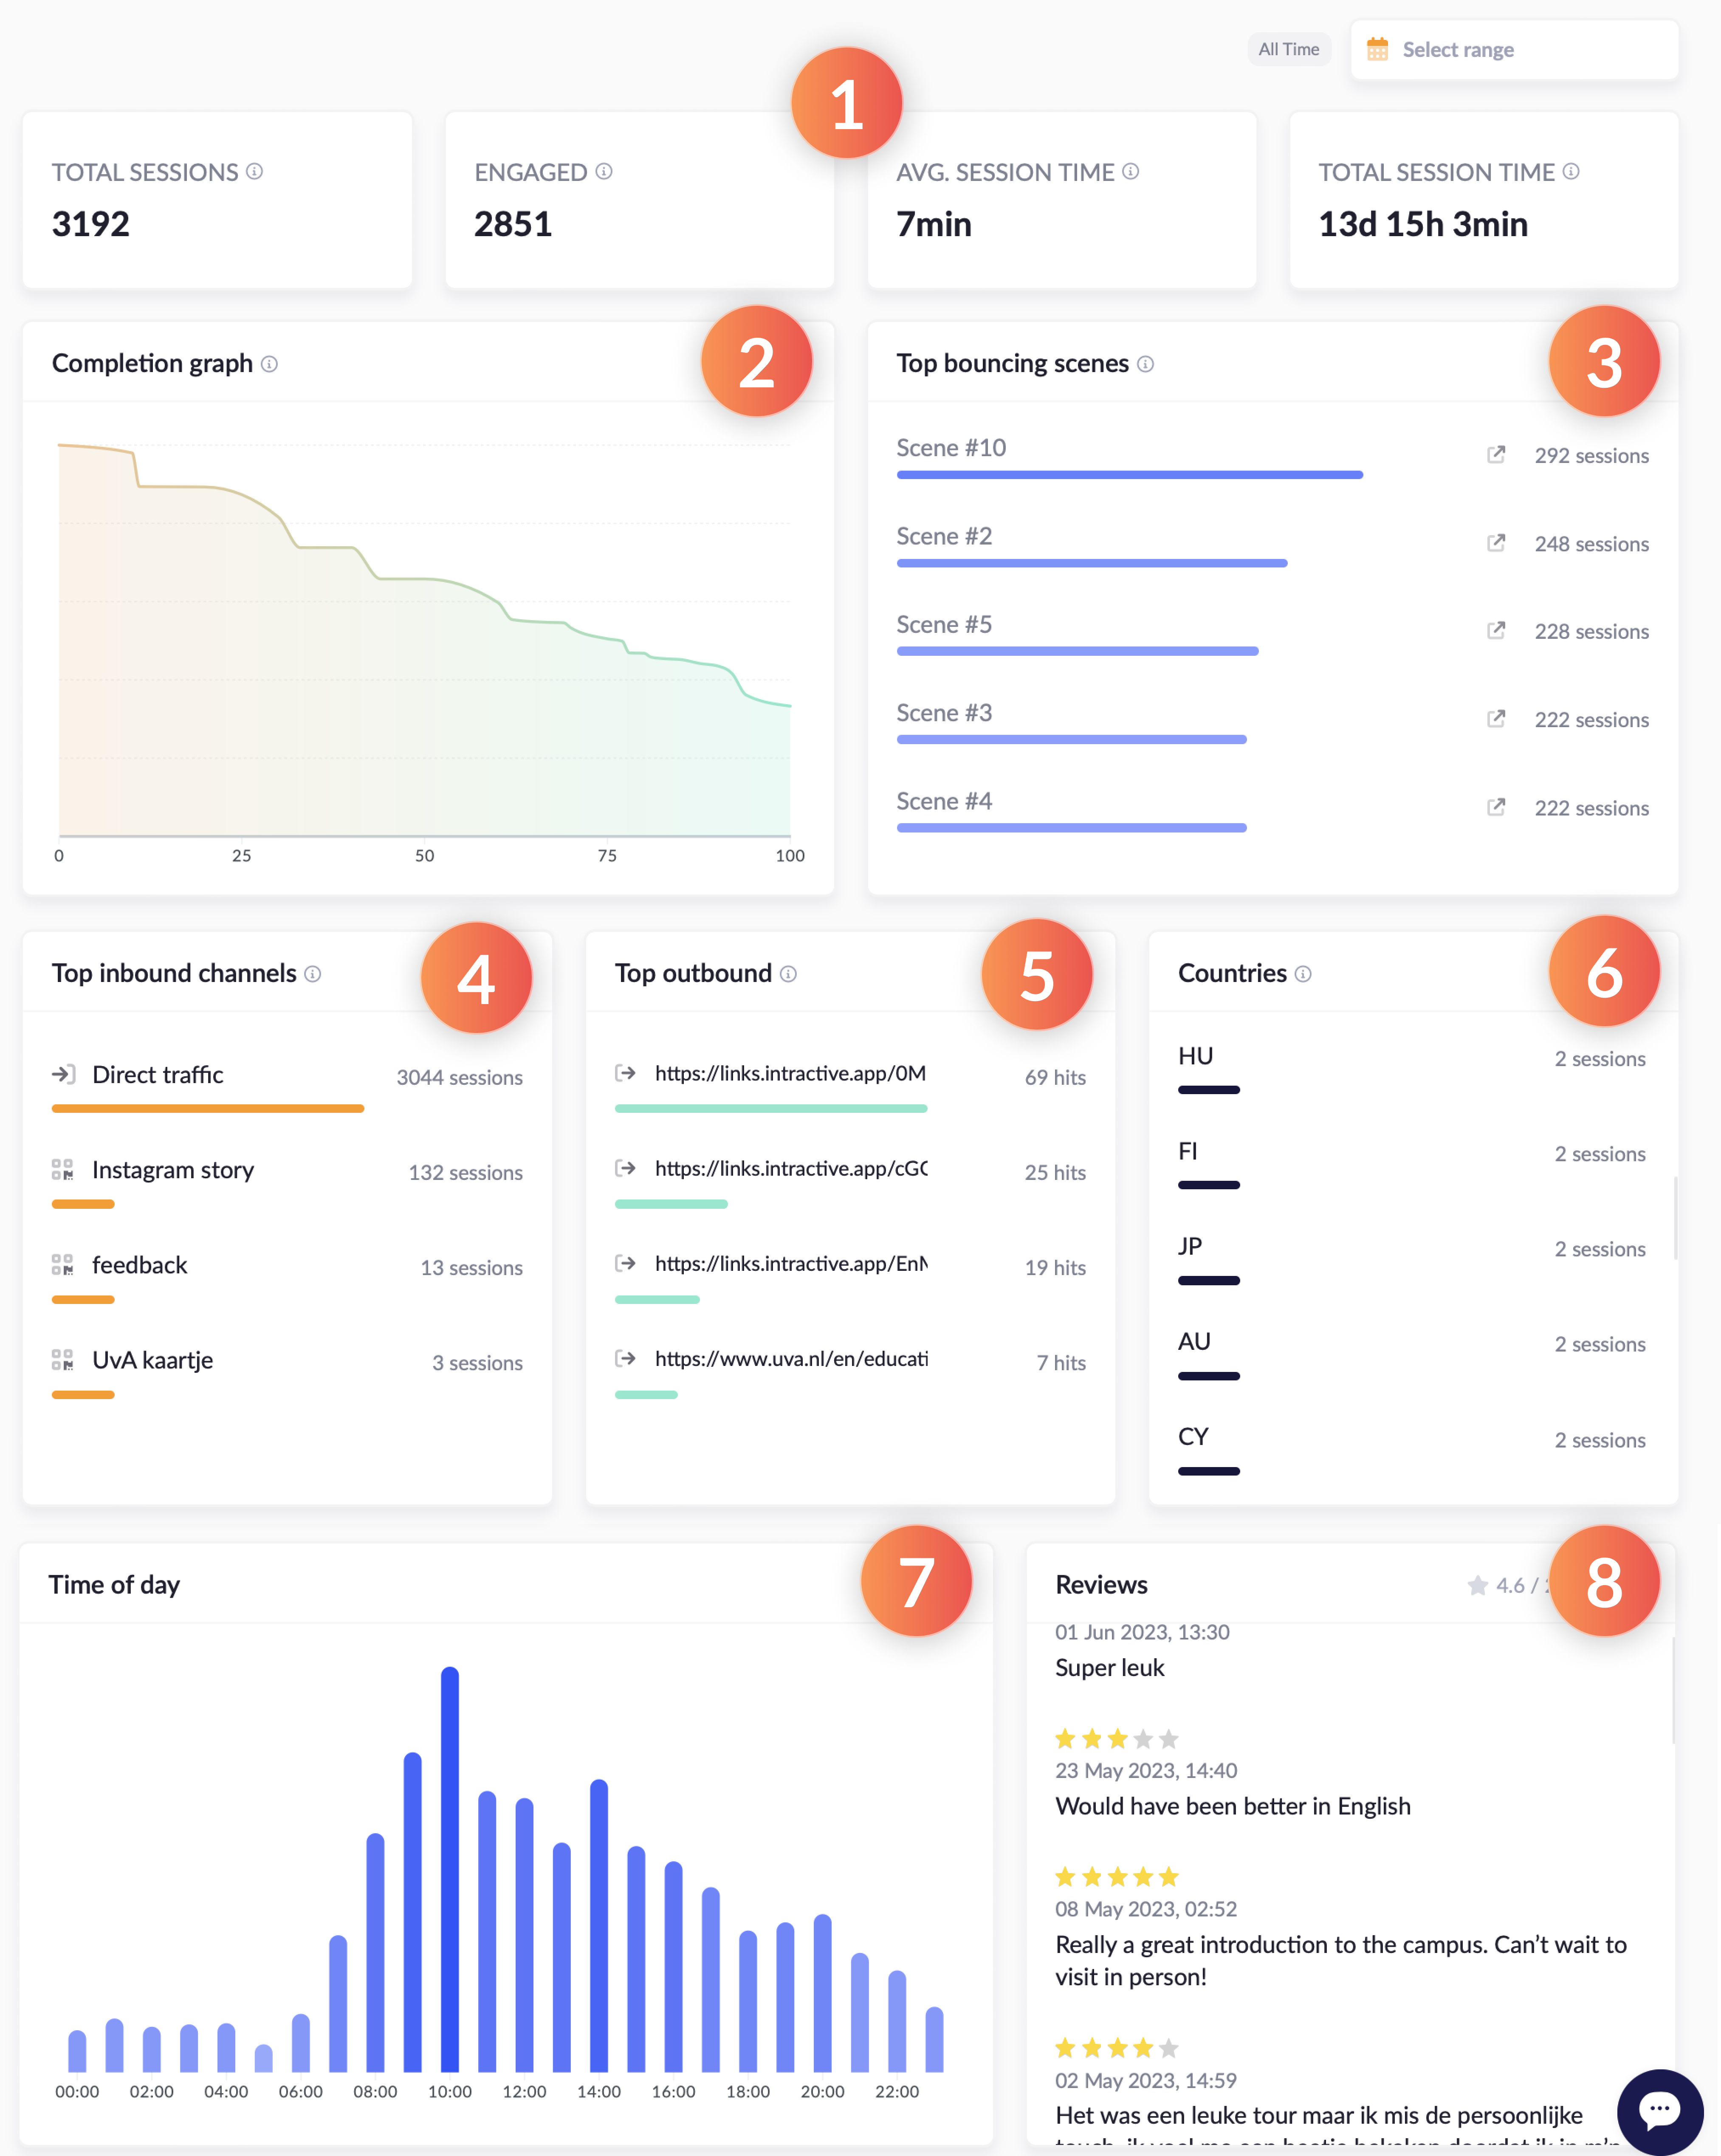
- General statistics. Here you'll find the following statistics:
Total sessions: unique users that have opened your story.
Engaged: users that made it past the first content block.
Avg. session time: the average time it took for to complete the full story.
Total session time: Total combined time that all engaged visitors spent in the story. - Completion graph. Percentage graph of how far users have gotten in your story. Note that this number can vary wildly based on various factors of your story (such as uncompleted branches), and should not be used as the sole measure of success.
- Top bouncing content blocks. A list that shows on what content blocks your users exit most often. This can help you track down issues with your scenario.
- Top inbound channels. Tracks where your users come from. So you can monitor which QR code/ link is most effective.
- Top outbound. Monitors where your users go at the end of the story, or on what links they click during the story.
- Countries. The countries that users view the story from.
- Time of day. Shows how much the story is viewed at any moment in the day.
- Reviews. Total number of ratings are shown on top, reviews with feedback are shown ordered by latest first.
At the top of the dashboard, you'll find a date range control. You can use this to limit the results to a specific date or period.
Sessions per day
If you had an important event or just launched a new campaign, and what to measure the impact day by day, you can scroll down to the monthly sessions overview.
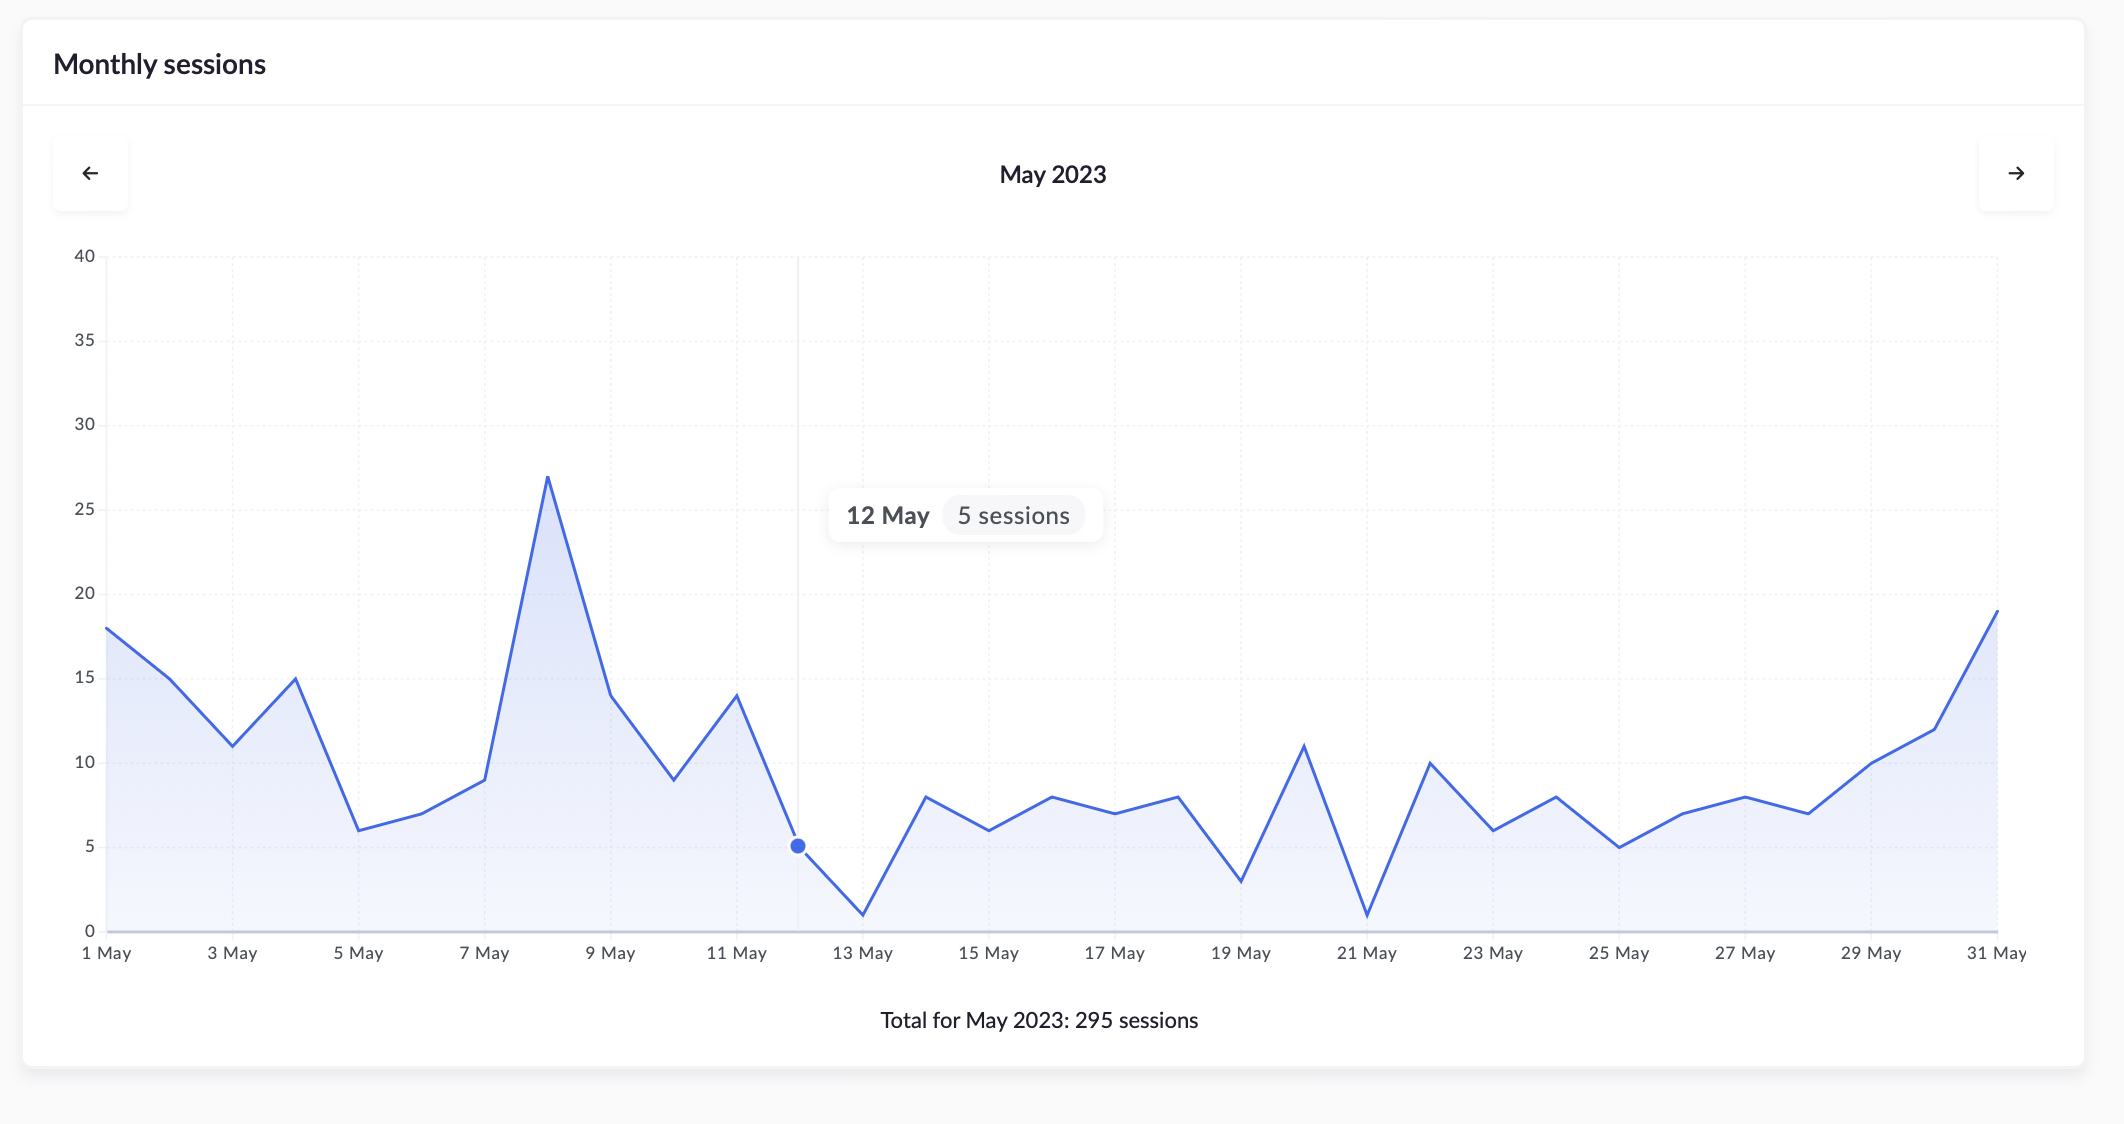
Move your mouse over each data point to see how many sessions occurred that day.
Special data gathering content blocks
Some content blocks gather data that are displayed on the analytics dashboard (such as Poll and Checklist). You can find this on the left under Answers & data. To learn more about these content blocks, click here.